Table of Contents
How much operating income did Berkshire have in Q1 of 2023?
Go to the “2023 First Quarter Report” https://berkshirehathaway.com/qtrly/1stqtr23.pdf . You can also go there via
https://www.berkshirehathaway.com/ -> Annual & Interim Reports
-> link corresponding to (row = Year 2023, column = 1st Quarter)
-> Click on "2023 First Quarter Report (PDF file)"
In the quarter report, go to pg-28 (Item 2. Management’s Discussion and Analysis of Financial Condition and Results of Operations) → Results of Operations which has the below table
                                                                    First Quarter
                                                                 2023        2022
Insurance – underwriting                                        $    911    $   167
Insurance – investment income                                      1,969      1,170
BNSF                                                               1,247      1,371
Berkshire Hathaway Energy (“BHE”)                                    416        775
Pilot Travel Centers (“Pilot”)                                        83         --
Manufacturing, service and retailing                               2,982      3,025
Non-controlled businesses*                                           568        282
Investment and derivative contract gains (losses)                 27,439     (1,580)
Other                                                               (111)       370
Net earnings attributable to Berkshire Hathaway shareholders    $ 35,504    $ 5,580
------------
*  Includes certain businesses in which Berkshire had between a 20% and 50% ownership interest.
To get the operating earnings, subtract “Investment and derivative contract gains (losses)” from “Net earnings attributable to Berkshire Hathaway shareholders”
So, the operating earnings in Q1 of 2023 are
>>> 35504 - 27439
8065
and the operating earnings in Q1 of 2022 are
>>> 5580 - (-1580)
7160
So, the operating earnings increased by 12.6%
>>> round( ((8065 / 7160) - 1)*100, 1)
12.6
Notes:
- The 12.6% and $8,065 million match with the numbers mentioned in the last paragraph of https://www.barrons.com/livecoverage/berkshire-hathaway-warren-buffett-annual-shareholder-meeting
Berkshire’s first-quarter results were released earlier on Saturday morning,
showing a 12.6% rise in operating profit, to $8.1 billion.
- https://www.businesswire.com/news/home/20230506005003/en/ shows that the operating earnings are \$8,065 million and \$7,160 million in Q1 or 2023 and 2022 respectively. This matches with the above calculation.
- This press release is a bit easier to understand about operating earnings compared to my approach. But I do not know how to generalize it for other quarters (ex:- how to get the corresponding businesswire link?).
- I found businesswire link in https://www.barrons.com/articles/berkshire-hathaway-inc-first-quarter-2023-earnings-release-e6e998bf
- The operating income can get revised at a later point in time. For example, https://www.businesswire.com/news/home/20220430005003/en shows that the original operating income for Q1 2022 was \$7,040 million. But https://www.businesswire.com/news/home/20230506005003/en shows that it got revised to \$7,160 million.
How much cash does Berkshire hold at the end of year 2022?
Go to the annual report https://www.berkshirehathaway.com/2022ar/2022ar.pdf . You can also go there via
https://www.berkshirehathaway.com/ -> Annual & Interim Reports
-> Year link corresponding to (row, column) = (2022, Annual)
-> Click on "2022 Annual Report (PDF file)"
In the annual report, go to pg-86 (K-70)
                  (dollars in millions)
                                                   2022
Insurance and Other:
  Cash and cash equivalents                        $32,260
  Short-term investments in U.S. Treasury Bills    $92,774
Railroad, Utilities and Energy:
  Cash and cash equivalents                        $ 3,551
Summing up all these numbers gives \$128,585. So Berkshire has about \$129 billion in cash.
See also:
- https://github.com/KamarajuKusumanchi/market_data/blob/master/berkshire/cash.txt - Berkshire's cash by quarter.
How much cash does Berkshire hold at the end of Q2 2023?
Go to the Q2 2023 report https://berkshirehathaway.com/qtrly/2ndqtr23.pdf. You can also go there via
https://berkshirehathaway.com/ -> Annual & Interim Reports
-> Link corresponding to (row, column) = (2023, 2nd Quarter)
-> Click on "2023 Second Quarter Report (PDF file)"
In the quarterly report, go to pg-3 in PDF (pg-2 in document) → Consolidated Balance Sheets
                  (dollars in millions)
                                                   June 30, 2023
Insurance and Other:
  Cash and cash equivalents                        $44,611
  Short-term investments in U.S. Treasury Bills    $97,322
Railroad, Utilities and Energy:
  Cash and cash equivalents                        $ 5,444
Summing up all these numbers gives \$147,377. So Berkshire has about \$147 billion in cash at the end of Q2 2023.
See also:
- https://github.com/KamarajuKusumanchi/market_data/blob/master/berkshire/cash.txt - Berkshire's cash by quarter.
dummy
net earnings vs operating earnings
When it comes to Berkshire, we should look at operating earnings instead of net earnings.
Berkshire holds a lot of stocks in their portfolio. As per the new GAAP rules, the stock portfolio's performance should be included into the earnings (even if they are not realized). So pure earnings will be very volatile. Whereas the operating earnings tell how the business is doing (and does not take into account of their stock portfolio).
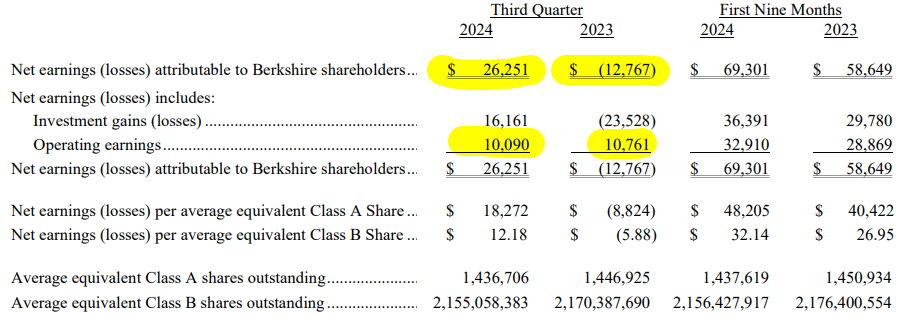
As an example, consider their Q3 2024 earnings. https://www.berkshirehathaway.com/news/nov0224.pdf shows
Net earnings went from -\$13 bln in Q3 2023 to \$26 bln in Q4 2023. Operating earnings went from \$11 bln to \$10 bln in the same period. So the business did slightly worse while the GAAP earnings paint a rosy picture.
See also:
- I have not found a good data source for Berkshire operating earnings. So I update it manually in my github repo https://github.com/KamarajuKusumanchi/market_data/blob/master/berkshire/original_operating_income_by_quarter.txt
What are the holdings of Berkshire?
- https://www.cnbc.com/berkshire-hathaway-portfolio/ - shows the holdings of Berkshire.
- update | asof 2024-10-27, the above link is not working.
- todo | find an alternative link
Board of directors
- Ronald L. Olson
Ref:- Full list can be found at https://www.berkshirehathaway.com/2001ar/directors.html
dummy
- Olson's board seats
- Berkshire Hathaway
- Western Asset Trusts
- Provivi
links I came across
- Berkshire's owner's manual - https://www.berkshirehathaway.com/owners.html
- In pdf format - https://www.berkshirehathaway.com/ownman.pdf
